
Understanding the Eth Coin Price: A Comprehensive Guide
Are you curious about the Eth coin price and how it fluctuates in the market? Well, you’ve come to the right place. In this detailed guide, we will delve into the various aspects that influence the Eth coin price, helping you gain a deeper understanding of this cryptocurrency. So, let’s dive right in!
What is Eth Coin?
Ethereum (ETH) is a decentralized platform that enables the creation of smart contracts and decentralized applications (DApps). It was launched in 2015 by Vitalik Buterin, a Russian-Canadian programmer. ETH is the native cryptocurrency of the Ethereum network and is used to pay for transaction fees and execute smart contracts.

Factors Influencing Eth Coin Price
Several factors contribute to the Eth coin price, and it’s essential to understand them to make informed decisions. Here are some of the key factors:
-
Market Supply and Demand
-
Market Sentiment
-
Regulatory Environment
-
Technological Developments
-
Economic Factors
Market Supply and Demand
The Eth coin price is primarily influenced by the supply and demand dynamics in the market. When demand for ETH increases, its price tends to rise, and vice versa. Factors such as adoption rates, market sentiment, and regulatory news can impact the demand for ETH.
Market Sentiment
Market sentiment plays a crucial role in determining the Eth coin price. Positive news, such as increased adoption or successful partnerships, can lead to a surge in demand and, subsequently, an increase in price. Conversely, negative news, such as regulatory crackdowns or security breaches, can cause panic selling and a drop in price.
Regulatory Environment
The regulatory environment is another critical factor that can impact the Eth coin price. Governments around the world are still figuring out how to regulate cryptocurrencies, and any news regarding regulatory changes can significantly affect the market. For instance, a country’s decision to ban or restrict the use of cryptocurrencies can lead to a sharp decline in their prices.
Technological Developments
Ethereum’s ongoing development and technological advancements can also influence the Eth coin price. For example, the Ethereum 2.0 upgrade, which aims to improve scalability and reduce transaction fees, has been a major driver of ETH price increases in recent years.
Economic Factors
Economic factors, such as inflation rates, interest rates, and currency fluctuations, can also impact the Eth coin price. For instance, during periods of economic uncertainty, investors may turn to cryptocurrencies as a safe haven, leading to an increase in demand and price.
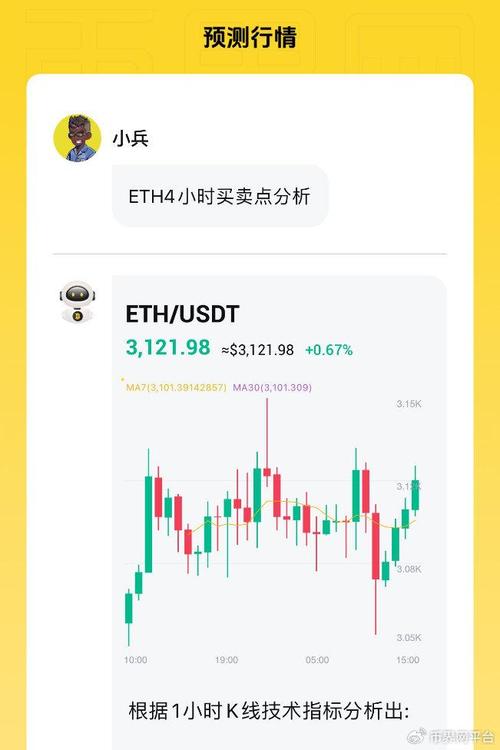
Understanding the Eth Coin Price Chart
When analyzing the Eth coin price, it’s essential to understand the price chart. Here are some key elements of a typical Eth coin price chart:
-
Time Frame
-
Price
-
Volume
-
Support and Resistance Levels
-
Technical Indicators
Time Frame
The time frame of a price chart represents the duration over which the data is displayed. Common time frames include 1 minute, 5 minutes, 15 minutes, 1 hour, 4 hours, 1 day, 1 week, and 1 month. The time frame you choose depends on your trading strategy and the level of detail you require.
Price
The price is the value of ETH at a specific point in time. It is displayed on the vertical axis of the chart. By analyzing the price movements, you can identify trends and potential entry and exit points for trading.
Volume
Volume represents the number of ETH being traded over a specific time frame. It is displayed on the horizontal axis of the chart. High volume indicates strong interest in the asset, while low volume may suggest a lack of interest or consolidation.
Support and Resistance Levels
Support and resistance levels are critical price levels where the market has repeatedly shown buying or selling interest. Support levels are where the price has found support and started to rise, while resistance levels are where the price has faced selling pressure and started to fall.