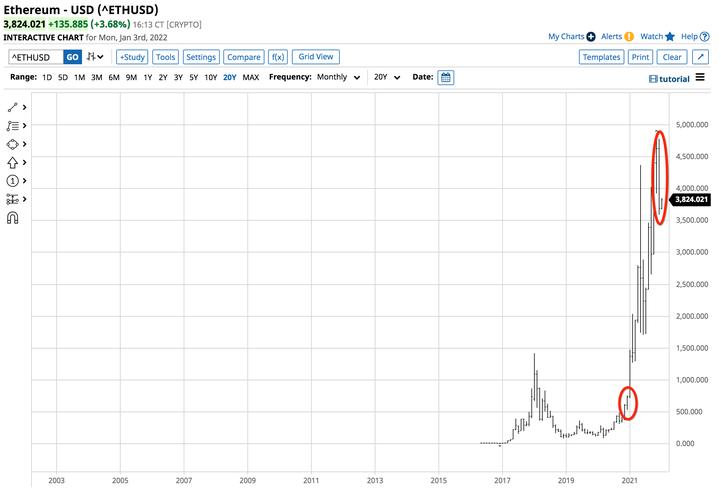
Understanding the ETH Crypto Price Chart: A Detailed Guide for You
When it comes to cryptocurrencies, Ethereum (ETH) has always been a prominent player. Its price chart is a vital tool for investors and enthusiasts alike, offering insights into the market’s trends and potential future movements. In this article, we will delve into the various aspects of the ETH crypto price chart, providing you with a comprehensive understanding of its dynamics.
What is the ETH Crypto Price Chart?
The ETH crypto price chart is a visual representation of the historical and current prices of Ethereum. It typically includes a timeline, showing the price changes over time, and various technical indicators that help analyze the market’s behavior.
Understanding the Price Chart
Let’s start by breaking down the essential components of the ETH crypto price chart:
- Timeframe: The chart can display prices over different timeframes, such as 1 minute, 30 minutes, 1 hour, 1 day, 1 week, or even 1 month. Choose the timeframe that suits your investment strategy.
- Price Line: This is the main line on the chart, showing the price of ETH over time.
- Volume: The volume represents the number of ETH being traded at a particular price. It’s usually displayed as a bar or histogram below the price line.
- Technical Indicators: These are tools that help analyze the market’s behavior. Common indicators include moving averages, RSI (Relative Strength Index), MACD (Moving Average Convergence Divergence), and Bollinger Bands.
Now, let’s dive deeper into each of these components:
Timeframe
Choosing the right timeframe is crucial for making informed decisions. Short-term traders might prefer a 1-minute or 30-minute chart, while long-term investors might opt for a 1-month or even 1-year timeframe. Each timeframe has its advantages and disadvantages:
| Timeframe | Advantages | Disadvantages |
|---|---|---|
| 1 Minute | Highly responsive to market changes | Can be overwhelming with noise |
| 30 Minutes | Good balance between responsiveness and noise | Not suitable for long-term investors |
| 1 Hour | Good for short-term and medium-term traders | Not as responsive as shorter timeframes |
| 1 Day | Great for medium-term and long-term traders | Not suitable for short-term traders |
| 1 Week | Excellent for long-term investors | Not suitable for short-term traders |
Price Line
The price line is the backbone of the ETH crypto price chart. It shows the historical and current prices of Ethereum. By analyzing the price line, you can identify trends, support and resistance levels, and potential reversal points.

Volume
Volume is a critical indicator of market activity. A high volume indicates strong interest in the asset, while a low volume suggests a lack of interest. By analyzing the volume, you can determine whether a price movement is driven by real demand or just speculation.
Technical Indicators
Technical indicators are tools that help you analyze the market’s behavior. Here are some of the most popular indicators:
- Moving Averages: These are averages of past prices over a specific period. They help identify trends and potential reversal points.
- RSI: This indicator measures the speed and change of price movements. It ranges from 0 to 100 and is used to identify overbought or oversold conditions.
- MACD: This indicator shows the relationship between two moving averages. It helps identify potential buy and sell signals.
- Bollinger Bands: These are a set of three lines that help identify potential overb
